
Financial Statement Discussion and Analysis 2019-20
Introduction
This Financial Statement Discussion and Analysis (FSD&A) should be read in conjunction with the Financial Statements of the Courts Administration Service (CAS) for the fiscal year ended March 31, 2020. These Financial Statements have been prepared using the Government's accounting policies, which are based on Canadian public sector accounting standards. The FSD&A has been prepared following the Public Sector Statement of Recommended Practice (SORP-1).
Responsibility for the preparation of the FSD&A rests with the management of CAS. The purpose of the FSD&A is to enhance the user’s understanding of the organization’s financial position and results of operations while demonstrating its accountability for its resources. Additional information on the organization’s performance is available in the Departmental Results Report.
Following this introduction, the FSD&A consists of three sections:
Please note that all financial information presented herein is denominated in Canadian dollars, unless otherwise indicated.
Special note regarding forward-looking statements
The words “estimate”, “will”, “intend”, “should”, “anticipate”, and similar expressions are intended to identify forward-looking statements that reflect assumptions and expectations of the organization, based on its experience and perceptions of trends and current conditions. Although CAS believes the expectations reflected in such forward-looking statements are reasonable, they may prove inaccurate; consequently, actual results could differ materially from expectations set out in this FSD&A. In particular, the risk factors described in this report could cause actual results or events to differ materially from those contemplated in forward-looking statements.
Overview
CAS was established in 2003 by the Courts Administration Service Act, S.C. 2002, c. 8. CAS’s role is to provide effective and efficient judicial, registry, e-courts, court security and internal services to the Federal Court of Appeal, the Federal Court, the Court Martial Appeal Court of Canada and the Tax Court of Canada (“the Courts”). The Chief Administrator of CAS serves as Deputy Head.
CAS was created to ensure the effective and efficient provision of administrative support to the four superior courts of record; to enhance judicial independence by placing administrative services at arm’s length from the Government of Canada and affirming the roles of the chief justices and judges in the management of the Courts; and to enhance accountability for the use of public money in support of court administration while safeguarding the independence of the judiciary. This ensures timely and fair access to the judicial system, which is essential to constitutional governance.
CAS’s budget is allocated through authorities approved by Parliament. CAS has one voted authority for program expenditures and statutory authorities for contributions to employee benefit plans, spending of proceeds from the disposal of surplus Crown assets, and refunds of amounts credited to revenues in previous years.
Since authorities are primarily based on cash flow requirements, authorities provided to CAS do not parallel financial reporting according to generally accepted accounting principles. Consequently, items recognized in the Statement of Financial Position and the Statement of Operations and Departmental Net Financial Position are not necessarily the same as those provided through authorities from Parliament. Note 3 of the Financial Statements provides a reconciliation between the bases of reporting.
The Financial Statements of CAS have not been audited. A Statement of Management Responsibility, including Internal Control over Financial Reporting (ICFR), is provided by Management as part of the annual departmental financial statement publication.
Special note regarding COVID-19
In response to the COVID-19 pandemic and the economic context, effective March 16, 2020, Courts Administration Service has activated its Business Continuity Plan (BCP) to ensure the delivery of critical activities and services. As of March 31, 2020, we have concluded that there was no impact on the effectiveness of internal control over financial reporting due to this change. We will continue to monitor the impact that this working arrangement has on our control environment.
Highlights
Parliamentary Authorities
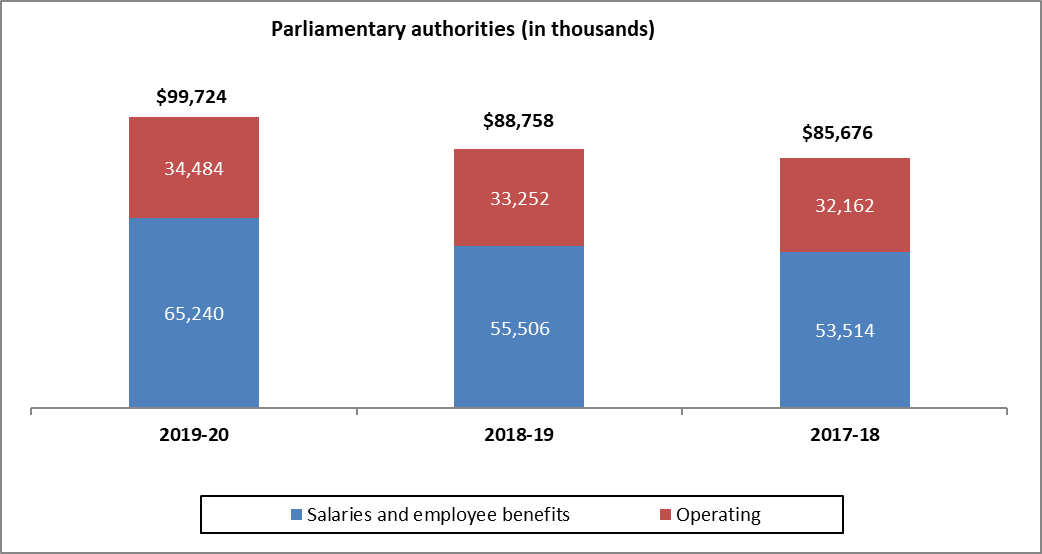
The parliamentary authorities available for use by CAS include funding received through the Main Estimates, Supplementary Estimates, Transfers, Adjustments and Warrants. These authorities increased by $10,966 thousand, from $88,758 thousand in 2018–19 to $99,724 thousand in 2019–20. This variance is the result of several factors, as outlined below.
Description of the image
Parliamentary authorities
In 2019–20, salaries and employee benefits plan authorities were $65,240 thousand. Operating authorities were $34,484 thousand. Total authorities were $99,724 thousand.
In 2018–19, salaries and employee benefits plan authorities were $55,506 thousand. Operating authorities were $33,252 thousand. Total authorities were $88,758 thousand.
In 2017–18, salaries and employee benefits plan authorities were $53,514 thousand. Operating authorities were $32,162 thousand. Total authorities were $85,676 thousand.
The increase in authorities is explained by a variance of $4,700 thousand in Program integrity funding to ensure that Canada's Federal Courts, including the Tax Court of Canada, to receive adequate supports over Program integrity issues. The increase includes $2,692 thousand to enhance the integrity of Canada’s Borders and Asylum System. The increase also includes a year’s off-cycle funding received for a courts and registry management system for the federal courts for $1,907 thousand.
In addition, increases in funding of $880 thousand for supporting the delivery of Justice through the Courts Administration Service, $866 thousand from Treasury Board transfer for paylist requirements, $700 thousand for supporting the delivery of justice for translation, $698 thousand in contributions to employee benefit plans compared to 2018–19 due to new funding received and other adjustments, $366 thousand due to the operating budget carry-forward and $92 thousand for compensation for collective bargaining.
The above increases were partially offset by the following decreases: $1,392 thousand in funding to implement a new comprehensive Intellectual Property (IP) Strategy, $258 thousand in funding for the Mexico Visa Lift initiative, $197 thousand to enhance procedural fairness in the citizenship revocation process under the Citizenship Act.
Various other minor changes resulted in an $88 thousand net decrease in authorities.
Financial Highlights
Statement of Financial Position
The Departmental Net Financial Position is the amount remaining when total liabilities are deducted from total assets. CAS’s Departmental Net Financial Position was $15,563 thousand as at March 31, 2020 ($13,617 thousand as of March 31, 2019).
Financial assets: The total net financial assets amounted to $15,883 thousand at March 31, 2020 ($19,725 thousand at March 31, 2019).
Non-financial assets: The year-end balance was $21,648 thousand at March 31, 2020 ($18,864 thousand at March 31, 2019).
Significant variations are provided further in the Financial Analysis section.
Statement of Operations and Departmental Net Financial Position
CAS’s net cost of operations before government funding and transfers was $125,223 thousand in 2019–20, an increase of $8,899 thousand (8%) compared to $116,324 thousand in 2018–19. These figures represent the total expenses incurred and revenues earned on behalf of government. The increase in total expenses is mainly due to increases in employee salaries and benefits, as well as professional and special services, which are explained further in the next section.
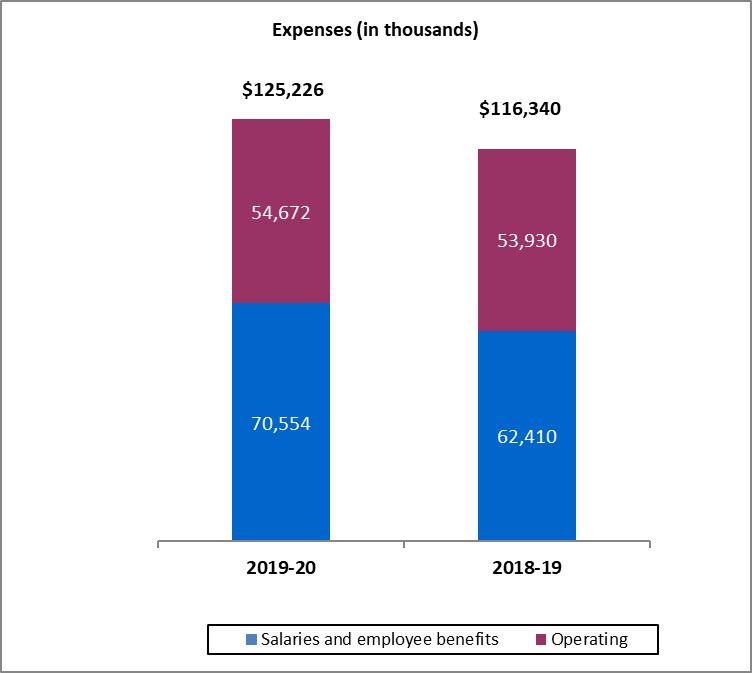
Expenses: CAS’s total expenses were $125,226 thousand in 2019–20 ($116,340 thousand in 2018–19).
Salary and employee benefits: Salary and employee benefit expenses amounted to $70,554 thousand ($62,410 thousand in 2018–19), an increase of $8,144 thousand (13%). The increase is subsequent to the new funding received, as described above. This resulted in an increase of 78 full-time equivalents and related augmentation in salary and employee benefits costs.
Operating: Operating expenses totalled $54,672 thousand ($53,930 thousand in 2018–19). The $742 thousand (1%) variance is mainly attributable to increases of $1,694 thousand in professional and special services, $171 thousand in the amortization of tangible capital assets, $58 thousand in accommodation and $11 thousand in materials and supplies. These increases were partly offset by decreases of $433 thousand in machinery and equipment, $349 thousand in other miscellaneous operating expenses and expenses incurred on behalf of Government, $189 thousand in repairs and maintenance, $96 thousand in Transportation and telecommunications, $77 thousand in Rentals and $48 thousand in information.
Description of the image
Expenses
In 2019–20, salaries and employee benefits plan expenses were $70,554 thousand. Operating expenses were $54,672 thousand. Total expenses were $125,226 thousand.
In 2018–19, salaries and employee benefits plan expenses were $62,410 thousand. Operating expenses were $53,930 thousand. Total expenses were $116,340 thousand.
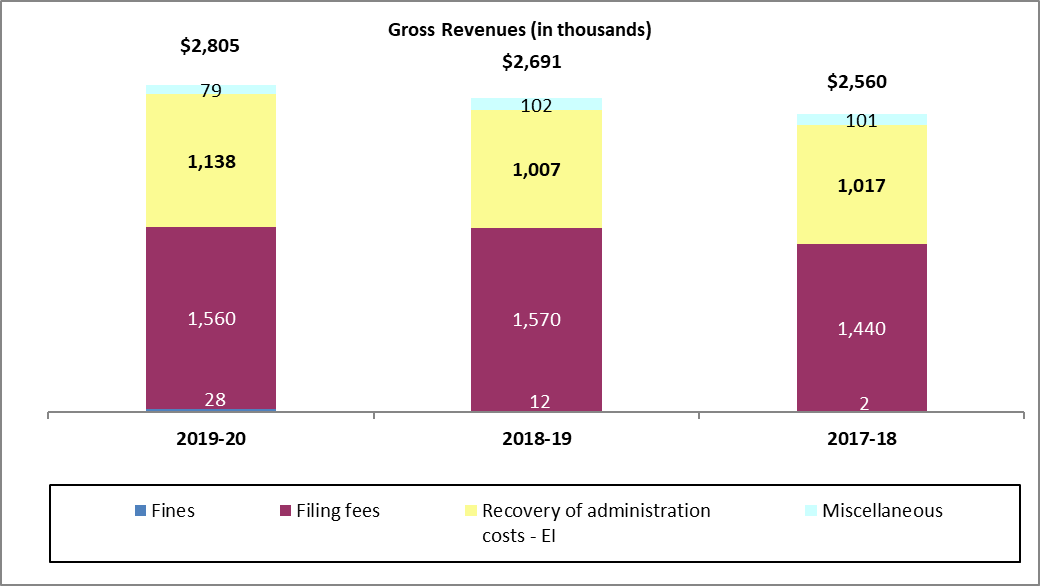
Revenues: The majority of CAS’s revenues are earned on behalf of Government. Such revenues are non-respendable, meaning that they cannot be used by CAS, and are deposited directly into the Consolidated Revenue Fund (CRF). CAS earns a small amount of respendable revenue from the sale of Crown assets. CAS’s gross revenues were $2,805 thousand ($2,691 thousand in 2018–19), and net revenues were $3 thousand ($16 thousand in 2018–19).
Description of the image
Gross Revenues
In 2019–20, recovery of administration costs – Employment Insurance (EI) was $1,138 thousand. Filing fees revenues were $1,560 thousand. Fines revenues were $28 thousand. Other revenues were $79 thousand. Total gross revenues were $2,805 thousand.
In 2018–19, recovery of administration costs – Employment Insurance (EI) was $1,007 thousand. Filing fees revenues were $1,570 thousand. Fines revenues were $12 thousand. Other revenues were $102 thousand. Total gross revenues were $2,691 thousand.
In 2017–18, recovery of administration costs – Employment Insurance (EI) was $1,017 thousand. Filing fees revenues were $1,440 thousand. Fines revenues were $2 thousand. Other revenues were $101 thousand. Total gross revenues were $2,560 thousand.
Discussion and analysis
Risks and uncertainties
Funding
The majority of non-personnel expenses incurred by CAS are contracted costs for services supporting the judicial process, court hearings, court security and e-court. They include translation services, protection services, informatics services, court reporters, transcripts, deputy judges, court ushers and court facilities rental. These costs are mostly driven by the number, type and duration of hearings conducted in any given year, are non-discretionary and limit the organization's financial flexibility.
CAS has a limited budget to respond to translation requirements of the courts despite additional funding received. In addition, CAS urgently requires additional funding to implement a modern Courts and Registry Management System (CRMS). As explained in the Risk Management Mitigation Strategies, CAS has received on-going funding to address many other areas of concern.
Risk Management
To address the risks arising from its program integrity issues, CAS has implemented various strategies, including reorganizing and realigning services, reallocating resources, establishing priorities and regularly reassessing them, as well as seeking efficiencies wherever possible. CAS has developed an efficient Enterprise Risk Management (ERM) process, which includes management participation at the highest levels of the organization. The ERM process allows management to identify, evaluate and mitigate key risks to achieving its mandate and organizational priorities, and drives resource allocation accordingly.
The Chief Justices and CAS has initiated discussion with government officials regarding a potential funding model more appropriate to the context of judicial independence. In the meantime, CAS has been able to secure additional funding through the budgetary process to address a number of specific pressures, including program integrity.
Budget 2019 provided two-year funding of $2,600 thousand to enhance the integrity of Canada’s Borders and Asylum System in and $1,700 thousand ongoing funding for translation services, as well as 5-year funding of $24,000 thousand to relocate the federal courthouse in Montréal.
The outbreak of the novel Coronavirus disease “COVID-19” pandemic has resulted in governments worldwide enacting emergency measures to combat the spread of the virus. These measures, which include the implementation of travel bans, self-imposed quarantine periods and social distancing, have caused material disruption to businesses globally resulting in an economic slowdown. The duration and impact of the COVID-19 outbreak is unknown at this time. As a result, it is not possible to reliably estimate the full length and severity of the impact on CAS financial position and future financial results.
Financial analysis
The following analysis describes the main items appearing on the financial statements, as well as significant variances and financial trends.
Liabilities
Summary: CAS’s total liabilities were $21,968 thousand as of March 31, 2020 ($24,972 thousand as of March 31, 2019). The variance of $3,004 thousand is due to a decrease in the accounts payable and accrued liabilities and in deposit accounts. The decrease was partly offset by an increase in Employee future benefits and vacation pay and compensatory leave.
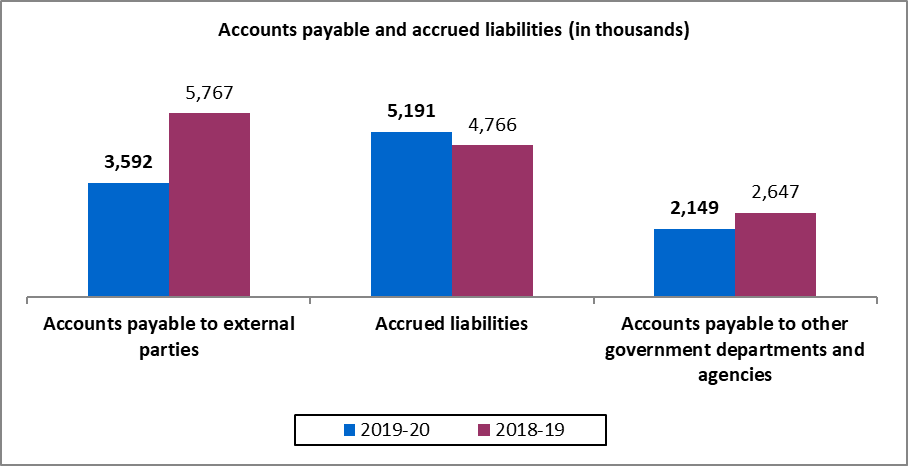
Accounts payable and accrued liabilities: CAS’s accounts payable and accrued liabilities totalled $10,932 thousand as of March 31, 2020 ($13,180 thousand as of March 31, 2019). The variance of $2,248 thousand is due to decreases of $2,175 thousand in accounts payable to external parties and $498 thousand in accounts payable to other government departments and agencies, primarily related to service delivery.
Please note that the decrease in accounts payable to external parties is mainly due to the COVID-19 situation. In response to the economic context related to the COVID-19 pandemic, the Office of the Comptroller General encourages departments to leverage flexibility within the policy on Financial Management to ensure prompt payment of invoices. Effective March 16, 2020, Courts Administration Service pays invoices before the 30-day term and applies additional flexibility in its risk-based payment methodology.
The decreases were offset by an increase of $425 thousand in accrued liabilities related to salaries and wages due to timing of the last pay period of the year (salary accrued), higher full-time equivalent count and Phoenix-related salary adjustments.
Description of the image
Accounts payable and accrued liabilities
In 2019–20, accounts payable to external parties were $3,592 thousand. Accrued liabilities were $5,191 thousand. Accounts payable to other government departments and agencies were $2,149 thousand.
In 2018–19, accounts payable to external parties were $5,767 thousand. Accrued liabilities were $4,766 thousand. Accounts payable to other government departments and agencies were $2,647 thousand.
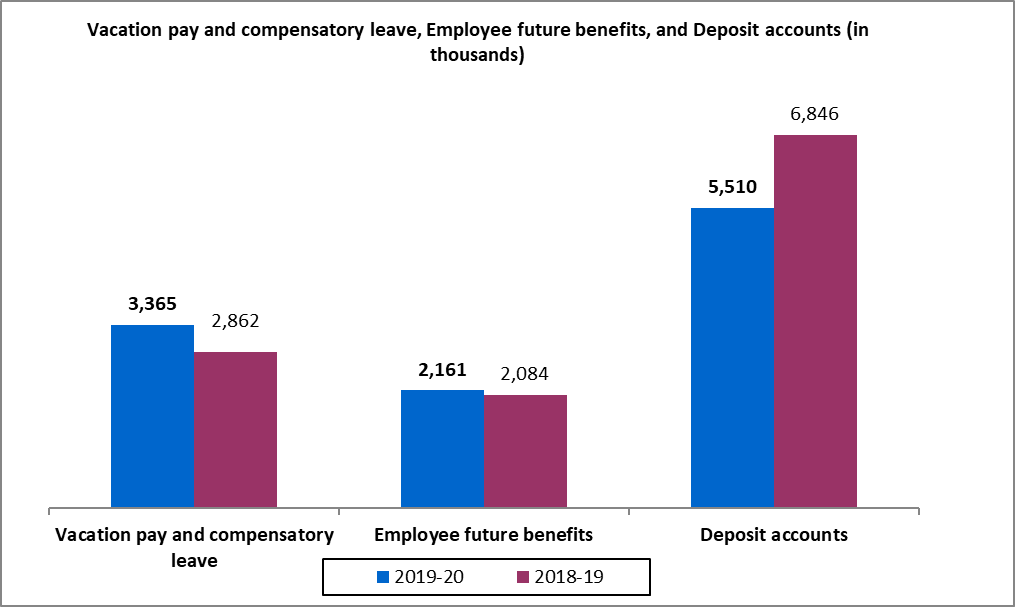
Vacation pay and compensatory leave: CAS’s vacation pay and compensatory leave year-end balance were $3,365 thousand as of March 31, 2020 ($2,862 thousand as of March 31, 2019). The increase of $503 thousand is subsequent to the Treasury Board Secretariat’s decision to postpone the automatic cash-out of vacation and compensatory leave, unless requested by the employee, due to the ongoing issues with the Phoenix Pay System.
Deposit accounts: CAS’s deposit accounts amounted to $5,510 thousand as at March 31, 2020 ($6,846 thousand as of March 31, 2019). CAS maintains two Specified Purpose Accounts (SPAs), one for deposits by litigants appearing before the Federal Court of Appeal or the Federal Court, and the other for those appearing before the Tax Court of Canada. These two accounts were established pursuant to Section 21.1 of the Financial Administration Act under Order in Council P.C. 1970 4/2 and Order in Council P.C. 1970-300, respectively. Pursuant to an order of the Court, amounts are held in trust and eventually released with accrued interest. Because payments into or out of the accounts are determined by the Courts, depending on the particular case, the balance is unpredictable and may vary significantly from year to year.
Employee severance benefits: CAS’s employee future benefits balance was $2,161 thousand as of March 31, 2020 ($2,084 thousand as at March 31, 2019). This allowance for severance benefits is payable to employees. Significant changes were made to the severance pay program, beginning in 2011–12,whereby benefits for voluntary departures ceased for some employee groups. Employees subject to these changes were given the option to be paid the full or partial value of benefits earned to date or collect the full or remaining value of benefits upon departure from the Public Service. The severance percentage factor used in calculating the liability is provided by the Treasury Board Secretariat, which is derived from the actuarially determined liability for severance benefits for the Government as a whole that takes into account this curtailment and planned settlements to date. The $77 thousand increase in the employee future benefits liability is mainly caused by the increase in indeterminate employees and increase in average salary earned but offset by the rate reduction of 0.3% (from 5.01% to 4.71%).
Description of the image
Vacation pay and compensatory leave, Employee future benefits, and Deposit accounts
In 2019–20, vacation pay and compensatory leave was $3,365 thousand. Employee future benefits were $2,161 thousand. Deposit accounts were $5,510 thousand.
In 2018–19, vacation pay and compensatory leave was $2,862 thousand. Employee future benefits were $2,084 thousand. Deposit accounts were $6,846 thousand.
Assets
Financial Assets
Summary: CAS’s assets are presented as financial assets (amount due from the Consolidated Revenue Fund (CRF) account, and accounts receivable and advances) and non-financial assets (prepaid expenses and tangible capital assets).
The decrease of $3,842 thousand between the Total net financial assets of $19,725 thousand as of March 2019 and $15,883 thousand as of March 31, 2020, is explained as follows:
- The year-end balance of the gross financial assets was $17,068 thousand ($20,770 thousand as of March 31, 2019). The variance of $3,702 thousand is due to a decrease in the amount due from the CRF and in accounts receivable and advances.
- Accounts receivable from non-respendable revenues in the amount $1,185 thousand as of March 31st, 2020 ($1,045 thousand as of March 31, 2019) are not available to discharge liabilities and therefore presented under financial assets held on behalf of Government as a reduction to the gross financial assets. The increase of $140 thousand accounts for the remaining variance.
Due from the Consolidated Revenue Fund: CAS’s due from the CRF year-end balance was $14,078 thousand as of March 31, 2020 ($18,092 thousand as of March 31, 2019). The decrease of $4,014 thousand is mainly due to a $1,336 thousand decrease of deposit accounts, a $2,108 thousand decrease in accounts payable, a $498 thousand decrease in the accounts payable from other government departments and a $496 thousand in accounts receivable and advances. Those decreases are Offset by a $424 thousand increase in accrued salaries and wages. Variances are primarily due to the timing of funding received and goods delivered, as well as issues with the Phoenix pay system. This account represents the net amount of cash that CAS is entitled to withdraw from the CRF in order to discharge its liabilities without generating any additional charges against its authorities in the year of the withdrawal. This includes expenses incurred but not yet paid and amounts received by CAS that can be paid out in future years, offset by accounts receivable from other government departments and agencies.
Furthermore, in response to the economic context related to the COVID-19 pandemic, the Office of the Comptroller General encourages departments to leverage flexibility within the policy on Financial Management to ensure prompt payment of invoices. Effective March 16, 2020, Courts Administration Service paid invoices before the 30-day term and apply additional flexibility in its risk-based payment methodology.
Accounts receivable and advances: CAS’s accounts receivable and advances balance was $2,990 thousand as of March 31, 2020 ($2,678 thousand as of March 31, 2019). The key components are accounts receivable from other government departments and agencies, and accounts receivable from external parties, offset by the allowance for doubtful accounts.
- Accounts receivable from other government departments and agencies: The year-end balance was $2,332 thousand ($1,997 thousand as of March 31, 2019). The increase of $335 thousand is largely due to a $499 thousand increase in receivables related to revenues from OGD (salary recoveries, Employment Insurance account, etc.) offset by a $164 thousand decrease in recoverable amounts related to taxes (GST/HST/QST).
- Accounts receivable from external parties: The year-end balance was $652 thousand ($668 thousand as of March 31, 2019). It includes photocopy fees charged to litigants and members of the general public, as well as employees’ salaries overpayments and other adjustments. The decrease of $16 thousand is due to a decrease of $31 thousand for other recoveries, offset by $11 thousand increase in salary recoveries from employees (2019–20 Phoenix issues) and an increase of $4 thousand in revenues from external parties (court fees, fines).
- Employee Advances: The year-end balance was $18 thousand ($14 thousand as of March 31, 2019), and is mostly attributable to the situation with the Phoenix pay system.
- Allowance for doubtful accounts: The year-end balance was $12 thousand ($1 thousand as of March 31, 2019). Over the past several years, CAS has been diligently reviewing and pursuing outstanding accounts receivable.
Financial assets held on behalf of Government: Accounts receivable from non-respendable revenues are presented under financial assets held on behalf of Government in the reduction of the gross financial assets. The year-end balance was $1,185 thousand ($1,045 thousand as of March 31, 2019). The $140 thousand increase is mainly due to a decrease in the accounts receivable from other government departments.
Departmental Net Debt
The Departmental Net Debt (total liabilities less total net financial assets) is an indicator that provides a measure of the future authorities required to pay for past transactions and events. The year-end balance was $6,085 thousand ($5,247 thousand as of March 31, 2019).
Non-financial Assets
Summary: The year-end balance was $21,648 thousand ($18,864 thousand as of March 31, 2019). The increase of $2,784 thousand is due to an increase of $2,521 thousand in tangible capital assets and a $472 thousand increase in inventories, offset by a decrease of $209 thousand in prepaid expenses. Tangible capital asset acquisitions for March 31, 2020, were $6,294 thousand. Leasehold improvements account for 44%, computer hardware and software account for 17%, machinery and equipment account for 13%, furniture and fixtures account for 5% and vehicles for 1% of CAS’s tangible capital assets, respectively.Together, these categories account for 79% of CAS’s tangible capital assets. The asset under construction – computer software of $1,066 thousand and asset under construction – other of $3,251 represent 21% of CAS’s tangible capital assets.
Please note that due to the materiality of the inventories, CAS as included it in non-financial assets inventories.
Tangible capital assets: As of March 31, 2020, CAS’s net book value of tangible capital assets was $20,710 thousand ($18,189 thousand as of March 31, 2019). The variance of $2,521 thousand represents acquisitions of $6,294 thousand, offset by amortization of $3,738 thousand and net adjustments of $35 thousand for acquisitions and amortization.
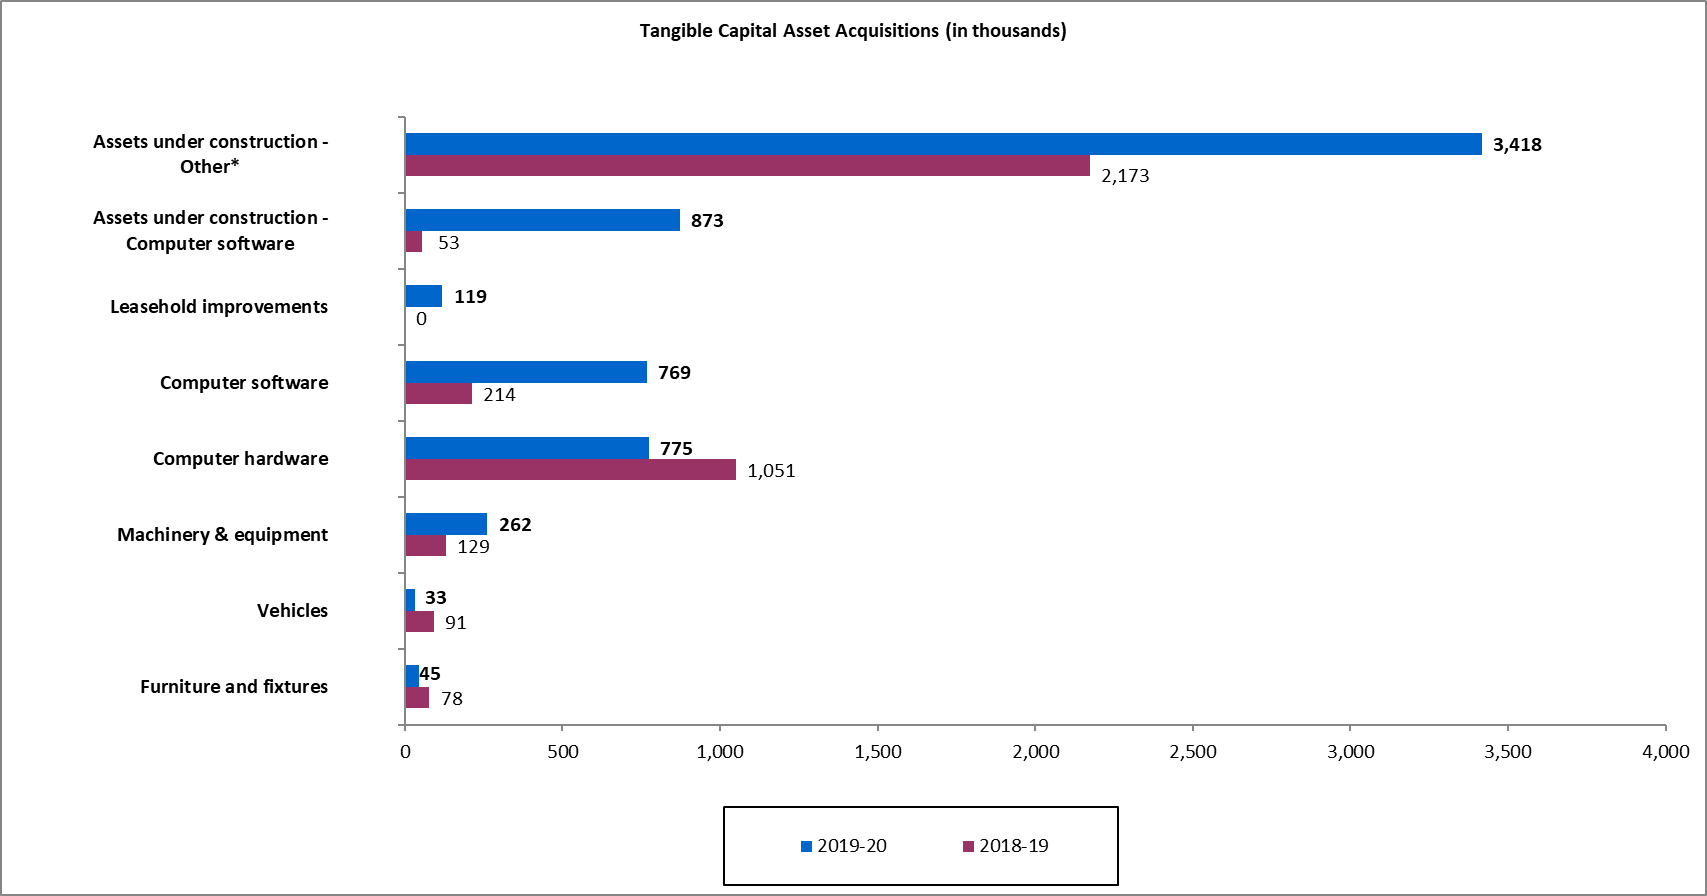
CAS’s capital asset acquisitions of $6,294 thousand ($3,789 thousand in 2018–19) were largely driven by projects related to physical and IT security as well as IT infrastructure:
- Leasehold improvements under construction ($3,418 thousand), are mainly related to the physical security enhancement projects, facilities renovation design.
- Software upgrades and improvements ($769 thousand) as well as software assets under construction ($873 thousand), and are mostly to window upgrade, purchase of software and software projects
- IT hardware upgrades totalled $775 thousand, and for the most part support the implementation of video conferencing, laptops, servers and other equipment;
- Machinery and equipment purchases ($262 thousand) are mainly forklifts and security equipment in support of the physical security enhancement projects;
- Purchases of furniture and fixtures ($45 thousand) are mostly for furniture for National Capital Region and region courtrooms and offices;
- Vehicle purchases totalled $33 thousand are related to the purchase of one vehicle.
Description of the image
Tangible Capital Asset Acquisitions
In 2019–20, furniture and fixture acquisitions were $45 thousand. Vehicle acquisitions were $33 thousand. Machinery & equipment acquisitions were $262 thousand. Computer hardware acquisitions were $775 thousand. Computer software acquisitions were $769 thousand. Leasehold improvements acquisitions were $119 thousand. Assets under construction-computer software acquisitions were $873 thousand. Assets under construction-other acquisitions were $3,418 thousand.
In 2018–19, furniture and fixture acquisitions were $78 thousand. Vehicle acquisitions were $91 thousand. Machinery & equipment acquisitions were $129 thousand. Computer hardware acquisitions were $1,051 thousand. Computer software acquisitions were $214 thousand. Leasehold improvements acquisitions were $0 thousand. Assets under construction-computer software acquisitions were $53 thousand. Assets under construction-other acquisitions were $2,173 thousand.
* Note: The category “Assets under construction - Other” includes leasehold improvements that have not been put into service.
Expenses
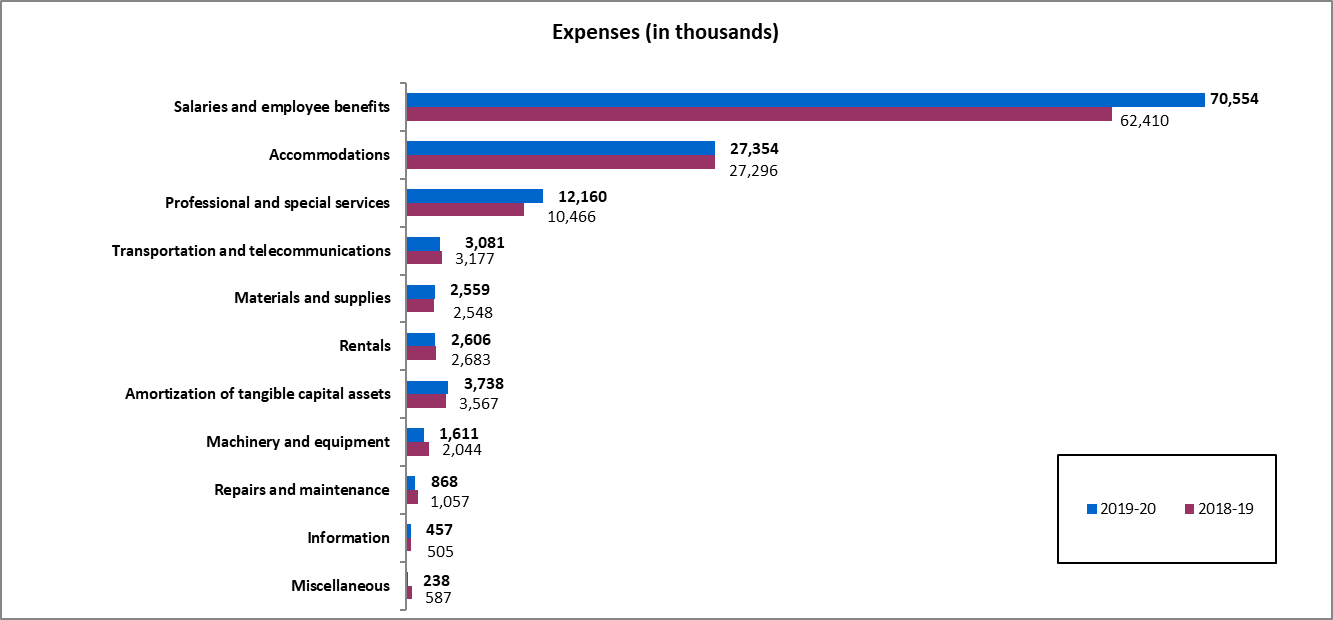
CAS’s total expenses were $125,226 thousand in 2019–20 ($116,340 thousand in 2018–19). The increase of $8,886 thousand (8%) is comprised of increases of $8,144 thousand in salaries and employee benefits, $1,694 thousand in professional and special services, $171 thousand in the amortization of tangible capital assets, $58 thousand in accommodation and $11 thousand in materials and supplies. These increases were partly offset by a decrease of $433 thousand in machinery and equipment, $349 thousand in other miscellaneous operating expenses and expenses incurred on behalf of Government $189 thousand in repairs and maintenance, $96 thousand in transportation and telecommunications, $77 thousand in rentals, $48 thousand in information. The variances are explained below.
The largest categories of expenses are: salaries and employee benefits (56.3% of total expenses in 2019–20, 53.6% in 2018–19), and accommodations (21.8% of total expenses in 2019–20, 23.5% in 2018–19). These two categories make up 78.1% of total expenses in the fiscal year 2019–20 and 77.1% in 2018–19.
Description of the image
Expenses
In 2019–20, salaries and employee benefits expenses were $70,554 thousand. Accommodation expenses were $27,354 thousand. Professional and special services expenses were $12,160 thousand. Transportation and telecommunications expenses were $3,081 thousand. Materials and supplies expenses were $2,559 thousand. Rentals expenses were $2,606 thousand. Amortization of tangible capital assets was $3,738 thousand. Machinery and equipment expenses were $1,611 thousand. Repair and maintenance expenses were $868 thousand. Information expenses were $457 thousand. Miscellaneous expenses were $238 thousand.
In 2018–19, salaries and employee benefits expenses were $62,401 thousand. Accommodation expenses were $27,296 thousand. Professional and special services expenses were $10,466 thousand. Transportation and telecommunications expenses were $3,177 thousand. Materials and supplies expenses were $2,548 thousand. Rentals expenses were $2,683 thousand. Amortization of tangible capital assets was $3,567 thousand. Machinery and equipment expenses were $2,044 thousand. Repair and maintenance expenses were $1,057 thousand. Information expenses were $505 thousand. Miscellaneous expenses were $587 thousand.
Salaries and employee benefits: Salaries and employee benefits expense was $70,554 thousand in 2019–20 ($62,410 thousand in 2018–19). These costs represent gross salaries and wages, overtime pay, retroactive salary adjustments, employee entitlements and allowances, severance pay, and pension and medical benefits. The $8,144 thousand (13%) variance is mainly due to an increase of 78 full-time equivalents subsequent to the new funding received.
Accommodations: Accommodations expense was $27,354 thousand in 2019–20 ($27,296 thousand in 2018–19). This amount represents the value of accommodation services, including rent, provided without charge by Public Services and Procurement Canada, a common service organization providing accommodation services to the Government.
Professional and special services: Professional and special services expense $12,160 thousand in 2019–20 ($10,466 thousand in 2018–19), an increase of $1,694 thousand (16.2%). These costs include translation services, protection services, IT services, court reporter and transcription services, deputy judges and training services. The increase is mainly due to an increase of $1,382 thousand in interpretation and translation services, $533 thousand other services, $271 thousand in Engineering and architectural services, $63 thousand in management consulting and $28 thousand in business services. These increases were partly offset by a decrease of $350 thousand in protection services, $112 thousand in informatics services and $121 thousand in various services such as health and welfare services, special fees, temporary help and training and Educational.
Transportation and telecommunications: Transportation and telecommunications expense was $3,081 thousand in 2019–20 ($3,177 thousand in 2018–19). The decrease of $96 thousand (-3%) is mainly driven by a $215 thousand decrease in Postage & Freight, offset by an increase of $100 thousand in relocation and $19 thousand for other expenditures.
Materials and supplies: Materials and supplies expense was $2,559 thousand in 2019–20 ($2,548 thousand in 2018–19). This includes legal books, publications and subscriptions (except electronic subscriptions), toner as well as stationery and supplies. The increase of $11 thousand (0.4 %) is mainly due to an increase of $70 thousand in books, publications and subscriptions and $10 thousand personal goods. Offset by $55 thousand in miscellaneous goods & products and other smaller variances resulted in a net decrease of $14 thousand.
Rentals: Rentals expense was $2,606 thousand in 2019–20 ($2,683 thousand in 2018–19). The decrease of $77 thousand (-3%) is primarily due to a $60 thousand decrease in the rental of office buildings, including our new Hamilton location, and rental of off-site locations for hearings. There was also a decrease of $17 thousand for other smaller expenditures.
Amortization of tangible capital assets: Amortization expense was $3,738 thousand in 2019–20 ($3,567 thousand in 2018–19). Tangible capital assets are expected to yield benefits over several years. Consequently, their cost is amortized on a straight-line basis over the estimated useful life of each asset class. The variance of $171 thousand is due to an increase $349 thousand related to leasehold improvements, $27 thousand related to machinery and equipment, $6 thousand for other equipment including furniture and fixtures. Partially offset by a decrease of $162 thousand for IT hardware assets, $47 thousand related to IT software and $2 thousand related to vehicles.
Machinery and equipment: Machinery and equipment expenses were $1,611 thousand in 2019–20 ($2,044 thousand in 2018–19). This includes purchases of assets costing less than $5 thousand, such as small computer parts, office equipment, furniture, and motor vehicle parts. The decrease of $433 thousand (-21.2%) is mainly to a decrease of $494 thousand in communication/network equipment <$5K and $213 thousand for image/video equipment <$5K. Offset by a decrease of $190K in Computer Equipment client <$5K and other minor variances of $84 thousand.
Repairs and Maintenance: Repairs and maintenance expense was $868 thousand in 2019–20 ($1,057 thousand in 2018–19). The decrease of $189 thousand (-17.9%) is mostly due to a decrease of $406 thousand in repairs and maintenance of buildings, mostly at a NCR headquarter and partly offset by an increase of $217 thousand in the maintenance of machinery and equipment.
Information: Information expense was $457 thousand in 2019–20 ($505 thousand in 2018–19). The $48 thousand decrease (-9.5%) is due to a decrease of $145 thousand in printing services and partly offset by an increase of $51 thousand in Communications professional services and $46K in subscriptions.
Miscellaneous and Expenses incurred on behalf of Government: Miscellaneous expenses (amortization of prepaid expenses, losses on disposal of tangible capital assets and write-downs, reallocation of capital assets, Interest charges on overdue supplier accounts and bad debt expense) was $238 thousand in 2019–20 ($587 thousand in 2018–19). The $349 thousand (-59.5%) decrease is mainly due to $472 thousand in inventory, offset by an increase of $ 194K in prepaid expenses. Other minor variances result in a net decrease of $71 thousand.
Revenues
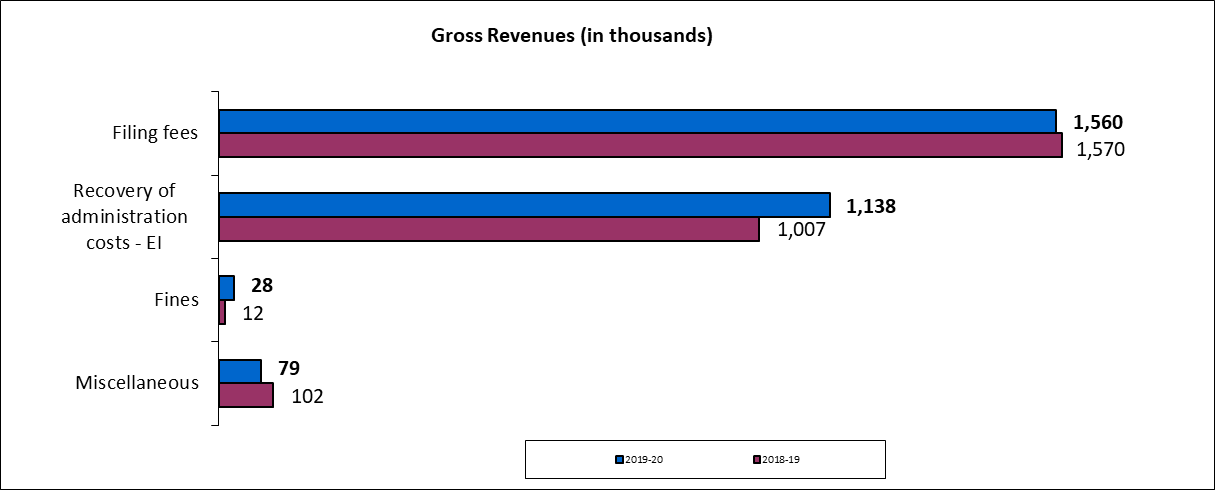
CAS’s gross revenues were $2,805 thousand in 2019–20 ($2,691 thousand in 2018–19). CAS’s revenues may fluctuate widely from year-to-year and consist almost entirely of revenues earned on behalf of the Government. Such revenues are non-respendable by CAS and are deposited directly into the CRF. In 2019–20, these non-respendable revenues totalled $2,802 thousand ($2,675 thousand in 2018–19).
CAS’s net revenues were $3 thousand in 2019–20 ($16 thousand in 2018–19). This consists of revenues from the disposal of Crown assets, which are respendable.
Filing fees: Filing fees revenue was $1,560 thousand in 2019–20 ($1,570 thousand in 2018–19). Filing fees are charged to register court documents pursuant to the legislation and rules governing the Courts.
Recovery of administration costs – Employment Insurance: Recovery of administration costs for Employment Insurance (EI) was $1,138 thousand in 2019–20 ($1,007 thousand in 2018–19). At the end of each fiscal year, CAS determines the cost associated with the administration of EI cases for presentation by Employment and Social Development Canada (ESDC), the department responsible for the EI account. Accordingly, ESDC reports an expense in its financial statements, and CAS reports an equivalent revenue item. This accounting exercise is intended to reflect the total cost of running the federal government's EI program and does not involve any transfer of authorities or funds.
Fines: Fines revenue was $28 thousand in 2019–20 ($12 thousand in 2018–19). As noted previously, these fines are imposed by the Courts. Consequently, the total amount of fine revenue may vary significantly from year to year and cannot be predicted.
Miscellaneous: Miscellaneous revenue was $78 thousand in 2019–20 ($102 thousand in 2018–20). Miscellaneous revenue is mainly composed of photocopy revenue.
Description of the image
Gross Revenues
In 2019–20, filing fees revenues were $1,560 thousand. Recovery of administration costs - EI was $1,138 thousand. Fines revenues were $28 thousand. Other revenues were $79 thousand.
In 2018–19, filing fees revenues were $1,570 thousand. Recovery of administration costs - EI was $1,007 thousand. Fines revenues were $12 thousand. Other revenues were $102 thousand.
- Date modified: