Financial Statement Discussion and Analysis
2016-17
INTRODUCTION
This Financial Statement Discussion and Analysis (FSD&A) should be read in conjunction with the Financial Statements of the Courts Administration Service (CAS) for the fiscal year ended
March 31, 2017. These Financial Statements have been prepared using the Government's accounting policies, which are based on Canadian public sector accounting standards. The FSD&A has been prepared following the Public Sector Statement of Recommended Practice (SORP-1).
Responsibility for the preparation of the FSD&A rests with the management of CAS. The purpose of the FSD&A is to enhance the user’s understanding of the organization’s financial position and results of operations while demonstrating its accountability for its resources. Additional information on the organization’s performance is available in the Departmental Results Report.
Following this introduction, the FSD&A consists of three sections:
Please note that all financial information presented herein is denominated in Canadian dollars, unless otherwise indicated.
Special note regarding forward-looking statements
The words “estimate”, “will”, “intend”, “should”, “anticipate”, and similar expressions are intended to identify forward-looking statements that reflect assumptions and expectations of the organization, based on its experience and perceptions of trends and current conditions. Although CAS believes the expectations reflected in such forward-looking statements are reasonable, they may prove to be inaccurate; consequently actual results could differ materially from expectations set out in this FSD&A. In particular, the risk factors described in this report could cause actual results or events to differ materially from those contemplated in forward-looking statements.
OVERVIEW
CAS was established in 2003 by the Courts Administration Service Act, S.C. 2002, c. 8 . CAS’ role is to provide effective and efficient registry, judicial and internal services to the Federal Court of Appeal, the Federal Court, the Court Martial Appeal Court of Canada and the Tax Court of Canada (“the Courts”). The Chief Administrator of CAS serves as Deputy Head.
CAS was created to ensure the effective and efficient provision of administrative support to the four superior courts of record; to enhance judicial independence by placing administrative services at arm’s length from the Government of Canada and affirming the roles of the chief justices and judges in the management of the Courts; and to enhance accountability for the use of public money in support of court administration while safeguarding the independence of the judiciary. This in turn ensures timely and fair access to the judicial system, which is essential to constitutional governance.
CAS’ budget is allocated through authorities approved by Parliament. CAS has one voted authority for program expenditures and statutory authorities for contributions to employee benefit plans, spending of proceeds from the disposal of surplus Crown assets, and refunds of amounts credited to revenues in previous years.
Authorities provided to CAS do not parallel financial reporting according to generally accepted accounting principles since authorities are primarily based on cash flow requirements. Consequently, items recognized in the Statement of Financial Position and in the Statement of Operations and Departmental Net Financial Position are not necessarily the same as those provided through authorities from Parliament. Note 3 of the Financial Statements provides a reconciliation between the bases of reporting.
The Financial Statements of CAS are not audited.
HIGHLIGHTS
Parliamentary Authorities
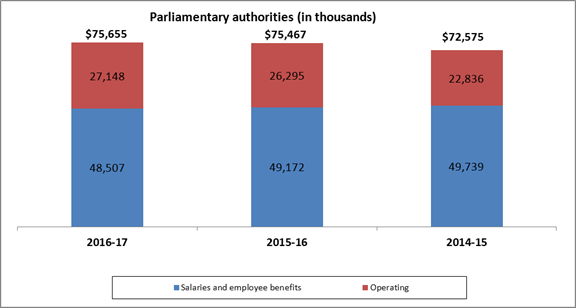
The parliamentary authorities available for use by CAS include funding received through the Main Estimates, Supplementary Estimates, Transfers, Adjustments and Warrants. These authorities increased slightly by $188 thousand, from $75,467 thousand in 2015-16 to $75,655 thousand in 2016-17. This variance is the result of several factors, as outlined below.
Description of the image
Parliamentary authorities
In 2016-17, salaries and employee benefit plan authorities were $48,507 thousand. Operating authorities were $27,148 thousand. Total authorities were $75,655 thousand.
In 2015-16, salaries and employee benefit plan authorities were $49,172 thousand. Operating authorities were $26,295 thousand. Total authorities were $75,467 thousand.
In 2014-15, salaries and employee benefit plan authorities were $49,739 thousand. Operating authorities were $22,836 thousand. Total authorities were $72,575 thousand.
This increase in authorities is partly due to $1,325 thousand in funding received in Budget 2016 to invest in information technology (IT) infrastructure to safeguard the efficiency of the federal court system. Also, $911 thousand was received in Budget 2016 to relocate the Quebec City Federal Courts facility, thereby ensuring continued Federal Courts presence in Quebec City. Furthermore, compensation for collective bargaining increases of $113 thousand was received in 2016-17.
The above increases were partly offset by a $917 thousand decrease between the 2016-17 and 2015-16 operating budget carry-forward funding and a $648 thousand decrease in transfer from Treasury Board for paylist requirements. This transfer includes severance pay and termination benefits, vacation credits payable upon termination of employment and parental benefits. Also, a $532 thousand decrease is related to Economic Action Plan 2014 Act, No. 2, which transferred the jurisdiction for payment of prothonotaries’ salaries, pensions, benefits and other administrative arrangements to the Office of the Commissioner for Federal Judicial Affairs Canada. In 2015-16, associated funding was frozen until it was removed from CAS’ 2016-17 reference levels.
Various other minor changes resulted in a $64 thousand net decrease in authorities.
Financial Highlights
Statement of Financial Position
The Departmental Net Financial Position is the amount remaining when total liabilities are deducted from total assets. CAS’ Departmental Net Financial Position was $7,650 thousand as at March 31, 2017 ($4,851 thousand as at March 31, 2016).
Liabilities: CAS’ total liabilities were $17,655 thousand as at March 31, 2017 ($17,488 thousand as at March 31, 2016). The $167 thousand variance is due to an increase in the accounts payable and accrued liabilities and a slight increase in vacation pay and compensatory leave which is partly offset by decreases in deposit accounts and employee future benefits.
Assets: CAS’ assets are presented as financial assets (amount due from the Consolidated Revenue Fund (CRF) account, and accounts receivable and advances) and non-financial assets (prepaid expenses and tangible capital assets).
Financial assets: The total net financial assets amounted to $12,457 thousand ($11,812 thousand as at March 31, 2016). The increase of $645 thousand is explained as follows:
- The year-end balance of the gross financial assets was $13,597 thousand ($12,970 thousand as at March 31, 2016). The variance of $627 thousand is due to an increase in accounts receivable and advances partly offset by a slight decrease in the amount due from the CRF.
- Accounts receivable from non-respendable revenues are not available to discharge liabilities. The corresponding amount of $1,140 thousand is therefore presented under financial assets held on behalf of Government as a reduction to the gross financial assets.
Non-financial assets: The year-end balance was $12,848 thousand ($10,527 thousand as at March 31, 2016). The increase of $2,321 thousand is due to an increase of $2,115 thousand in tangible capital assets and a $206 thousand increase in prepaid expenses. Tangible capital asset acquisitions of $3,956 thousand were made that were offset by amortization of $1,833 thousand and a write-down of $8 thousand. Leasehold improvements account for 43%, computer hardware and software account for 28%, machinery and equipment account for 21%, and furniture and fixtures account for 7% of CAS’ tangible capital assets, respectively.Together, these categories account for 99% of CAS’ tangible capital assets.
Statement of Operations and Departmental Net Financial Position
CAS’ net cost of operations before government funding and transfers was $101,093 thousand in 2016-17, a decrease of $845 thousand (1%) compared to $101,938 thousand in 2015-16. These figures are net of expenses incurred and revenues earned on behalf of government. The decrease in total expenses is mainly due to decreases in accommodations, as well as professional and special services, which are explained further in the next section.
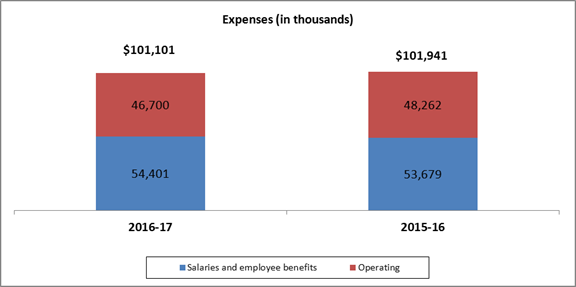
Expenses: CAS’ total expenses were $101,101 thousand in 2016-17 ($101,941 thousand in 2015-16).
Salary and employee benefits: Salary and employee benefit expenses amounted to $54,401 thousand ($53,679 thousand in 2015-16). The $722 thousand (1.35%) variance is mainly due to an increase of 17 full-time equivalents, resulting in increases of $1,017 thousand in Salaries and Wages and $357 thousand in employer contribution to the health and dental insurance plans (related party transaction), offset by a decrease of $630 thousand in the provision for severance benefits and $22 thousand in employer contributions to employee benefit plans. Part of the increase in full-time equivalents was to deal with additional work and compensatory controls to address over and under payments resulting from the Phoenix Pay System. More than half of CAS’ total expenses consist of salaries and employee benefits.
Operating: Operating expenses totalled $46,700 thousand ($48,262 thousand in 2015-16). The $1,562 thousand (3.2%) variance is mainly attributable to decreases of $1,894 thousand in professional and special services, $896 thousand in accommodations, $345 thousand in machinery and equipment, $70 thousand in materials and supplies, and $31 thousand in information. These decreases were partly offset by an increase of $667 thousand in the amortization of tangible capital assets, $450k thousand in Repairs and maintenance, $370 thousand in Rentals and $170k in Transportation and telecommunications. Other smaller variances resulted in a net increase of $17 thousand. The above variances are explained in the Financial Analysis section.
Description of the image
Expenses
In 2016-17, salaries and employee benefit plan expenses were $54,401 thousand. Operating expenses were $46,700 thousand. Total expenses were $101,101 thousand.
In 2015-16, salaries and employee benefit plan expenses were $53,679 thousand. Operating expenses were $48,262 thousand. Total expenses were $101,941 thousand.
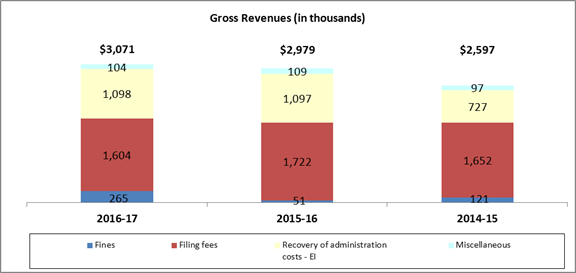
Revenues: The majority of CAS’ revenues are earned on behalf of Government. Such revenues are non-respendable, meaning that they cannot be used by CAS, and are deposited directly into the CRF. CAS earns a small amount of respendable revenue from the sale of Crown assets. CAS’ gross revenues were $3,071 thousand ($2,979 thousand in 2015-16) and net revenues were
$8 thousand ($3 thousand in 2015-16).
Description of the image
Gross Revenues
In 2016-17, recovery of administration costs – Employment Insurance was $1,098 thousand. Filing fees revenues were $1,604 thousand. Fines revenues were $265 thousand. Other revenues were $104 thousand. Total gross revenues were $3,071 thousand.
In 2015-16, recovery of administration costs – Employment Insurance was $1,097 thousand. Filing fees revenues were $1,722 thousand. Fines revenues were $51 thousand. Other revenues were $109 thousand. Total gross revenues were $2,979 thousand.
In 2014-15, recovery of administration costs – Employment Insurance was $727 thousand. Filing fees revenues were $1,652 thousand. Fines revenues were $121 thousand. Other revenues were $97 thousand. Total gross revenues were $2,597 thousand.
DISCUSSION AND ANALYSIS
Risks and Uncertainties
Funding
The majority of non-personnel expenses incurred by CAS are contracted costs for services supporting the judicial process and court hearings. They include translation, court reporters, transcripts, and security services, and they are mostly driven by the number, type and duration of hearings conducted in any given year. These are non-discretionary and limit the organization's financial flexibility.
CAS has been facing a program integrity situation for many years, which has resulted from various ongoing pressures and has impacted CAS’ ability to deliver its core mandate while meeting legislative and policy requirements. Although it is an important priority for the courts and their users, CAS has been unable to procure and implement a modern court and registry management system to replace unreliable legacy systems and support the transition to fully electronic services. CAS also has a limited budget to respond to increases in the resources required to support the judicial process and translation costs, which result from increases in the quantity and complexity of court cases, as well as increases in the number of self-representing litigants who require more assistance. Furthermore, external drivers that influence costs, such as inflation and government cost-saving measures, represent additional challenges.
Risk Management
To address the risks arising from its program integrity issues, CAS has implemented various strategies, including reorganizing and realigning services, reallocating resources, establishing priorities and regularly reassessing them, as well as seeking efficiencies wherever possible. Having assessed a number of different financial models, CAS is trying to secure additional funding. CAS received some program integrity funding in Budget 2015 specifically for physical and IT security.
Budget 2016 provided $7.9 million over five years, as well as ongoing funding, to invest in IT infrastructure upgrades to safeguard the efficiency of the federal court system. Budget 2016 also provided up to $2.6 million over two years on a cash basis to relocate the Quebec City Federal Courts facility, thereby ensuring continued Federal Courts presence in Quebec City.
CAS continues to work with central agencies to identify sources of funds to address outstanding risks.
Financial Analysis
The following analysis explains the main items appearing on the financial statements, as well as significant variances and financial trends.
Liabilities
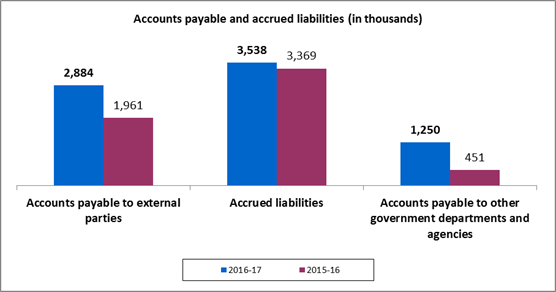
Accounts payable and accrued liabilities: CAS’ accounts payable and accrued liabilities totalled $7,672 thousand as at March 31, 2017 ($5,781 thousand as at March 31, 2016). The variance of $1,891 thousand is due to increases of $923 thousand in accounts payable to external parties and $799 thousand in accounts payable to other government departments and agencies, primarily due to timing of equipment and service delivery, as well as $169 thousand in accrued liabilities related to salaries and wages, due to timing of the last pay period of the year.
Description of the image
Accounts payable and accrued liabilities
In 2016-17, accounts payable to external parties were $2,884 thousand. Accrued liabilities were $3,538 thousand. Accounts payable to other government departments and agencies were $1,250 thousand.
In 2015-16, accounts payable to external parties were $1,961 thousand. Accrued liabilities were $3,369thousand. Accounts payable to other government departments and agencies were $451 thousand.
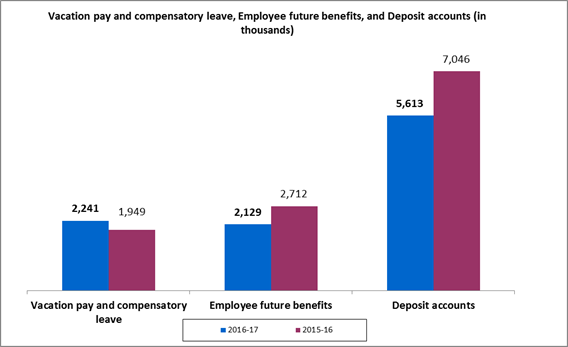
Vacation pay and compensatory leave: CAS’ vacation pay and compensatory leave year-end balance was $2,241 thousand as at March 31, 2017 ($1,949 thousand as at March 31, 2016). The increase of $292 thousand is mainly due to an increase in vacation pay.
Employee future benefits:CAS’ employee future benefits balance was $2,129 thousand as at March 31, 2017 ($2,712 thousand as at March 31, 2016). This amount represents an allowance for severance benefits payable to employees. Beginning in 2011-12, significant changes were made to the severance pay program, whereby benefits for voluntary departures ceased for employee groups. Employees subject to these changes were given the option to be paid the full or partial value of benefits earned to date or collect the full or remaining value of benefits upon departure from the public service. The severance percentage factor used in calculating the liability is provided by the Treasury Board Secretariat, which is derived from the actuarially determined liability for severance benefits for the Government as a whole that takes into account this curtailment and plan settlements to date. The rate decreased in 2016-17 by 1.8%. The $583 thousand decrease in the employee future benefits liability is the net result of the decrease of the rate and an increase of 17 in the number of employees included in the severance pay calculation.
Deposit accounts: CAS’ deposit accounts amounted to $5,613 thousand as at March 31, 2017 ($7,046 thousand as at March 31, 2016). CAS maintains two Specified Purpose Accounts (SPAs), one for deposits by litigants appearing before the Federal Court of Appeal or the Federal Court, and the other for those appearing before the Tax Court of Canada. These two accounts were established pursuant to Section 21.1 of the Financial Administration Act under Order in Council P.C. 1970 4/2 and Order in Council P.C. 1970-300, respectively. Pursuant to an order of the Court, amounts are held in trust and eventually released with accrued interest. Because payments into or out of the accounts are determined by the Courts, depending on the particular case, the balance is unpredictable and may vary significantly from year to year.
Description of the image
Vacation pay and compensatory leave, Employee future benefits, and Deposit accounts
In 2016-17, vacation pay and compensatory leave was $2,241 thousand. Employee future benefits were $2,129 thousand. Deposit accounts were $5,613 thousand.
In 2015-16, vacation pay and compensatory leave was $1,949 thousand. Employee future benefits were $2,712 thousand. Deposit accounts were $7,046 thousand.
Assets
Financial Assets
Due from the Consolidated Revenue Fund: CAS’ due from the CRF year-end balance was $11,123 thousand as at March 31, 2017 ($11,363 thousand as at March 31, 2016). The decrease of $240 thousand is mainly due to a $1,433 thousand decrease in the deposit accounts, a $615 thousand increase in accounts receivable from other government departments and a $15 thousand increase in advances, offset by a $799 thousand increase in accounts payable to other government departments, $530 thousand increase in accounts payable and a $494 thousand increase in accrued liabilities. This account represents the net amount of cash that CAS is entitled to withdraw from the CRF in order to discharge its liabilities without generating any additional charges against its authorities in the year of the withdrawal. This includes expenses incurred but not yet paid and amounts received by CAS that can be paid out in future years, offset by accounts receivable from other government departments and agencies.
Accounts receivable and advances:CAS’ accounts receivable and advances balance was $2,474 thousand as at March 31, 2017 ($1,607 thousand as at March 31, 2016). The key components of this balance are accounts receivable from other government departments and agencies, and accounts receivable from external parties, offset by the allowance for doubtful accounts.
- Accounts receivable from other government departments and agencies: The year-end balance was $2,174 thousand ($1,514 thousand as at March 31, 2016). The increase of $660 thousand is largely due to a $483 thousand increase in the amount allocated to Employee Benefit plan, a $106 thousand increase in receivables related to salaries and a $56 thousand increase in recoverable amounts related to taxes (GST/HST/QST). Other minor variances resulted in a net increase of $15 thousand.
- Accounts receivable from external parties: The year-end balance was $287 thousand ($87 thousand as at March 31, 2016). It includes photocopy fees charged to litigants and members of the general public, as well as employees’ salaries overpayments and other adjustments. The increase of $256 thousand due to salary overpayments relates to the issues with the Phoenix pay system.
- Employee Advances: The year-end balance was $22 thousand ($7 thousand as at March 31, 2016), and is mostly attributable to the situation with the Phoenix pay system.
- Allowance for doubtful accounts: The year-end balance was $9 thousand ($1 thousand as at March 31, 2016). Over the past several years, CAS has been diligently reviewing and pursing outstanding accounts receivable.
Financial assets held on behalf of Government: Accounts receivable from non-respendable revenues are presented under financial assets held on behalf of Government in reduction of the gross financial assets. The year-end balance was $1,140 thousand ($1,158 thousand as at March 31, 2016). The $18 thousand decrease reflects an $11 thousand decrease in the deposits in Transit to the Receiver General and other minor variances resulting in a net decrease of $7 thousand.
Departmental Net Debt
The Departmental Net Debt (total liabilities less total net financial assets) is an indicator that provides a measure of the future authorities required to pay for past transactions and events. The year-end balance was $5,198 thousand ($5,676 thousand as at March 31, 2016).
Non-financial Assets
Tangible capital assets:CAS’ net book value of tangible capital assets was $12,462 thousand ($10,347 thousand as at March 31, 2016). The variance of $2,115 thousand represents acquisitions of $3,956 thousand, offset by amortization of $1,833 thousand and a vehicle write-down of $8 thousand.
CAS’ capital asset acquisitions of $3,956 thousand ($3,908 thousand in 2015-16) were largely driven by new projects related to physical and IT security as well as IT infrastructure. Tangible capital assets acquisitions were as follows:
- Machinery and equipment purchases ($474 thousand) including those under construction ($841 thousand) totalled $1,315 thousand, and comprise security equipment in support of the physical security enhancement project;
- Leasehold improvements ($133 thousand) and under construction ($732 thousand) totalled $865 thousand, and are related to the physical security enhancement project;
- Software upgrades and improvements ($97 thousand) totalled $862 thousand, including assets under development ($765 thousand), and for the most part support the implementation of the Virtual Storage Area Network (VSAN) environment;
- The purchase of furniture and fixtures ($672 thousand) and those for projects under construction ($21 thousand) totalled $693 thousand, and are mostly for the physical security enhancement project; and
- IT hardware upgrades totalled $221 thousand, and for the most part support the implementation of the VSAN environment.
Tangible capital asset acquisitions In 2016-17, furniture and fixture acquisitions were $672 thousand. Vehicle acquisitions were $0 thousand. Machinery & equipment acquisitions were $474 thousand. Computer hardware acquisitions were $221 thousand. Computer software acquisitions were $97 thousand. Leasehold improvements acquisitions were $133 thousand. Assets under construction-computer software acquisitions were $765 thousand. Assets under construction-other acquisitions were $1,594 thousand.
In 2015-16, furniture and fixture acquisitions were $187 thousand. Vehicle acquisitions were $60 thousand. Machinery & equipment acquisitions were $147 thousand. Computer hardware acquisitions were $1,687 thousand. Computer software acquisitions were $251 thousand. Leasehold improvements acquisitions were $570 thousand. Assets under construction-computer software acquisitions were $296 thousand. Assets under construction-other acquisitions were $710 thousand.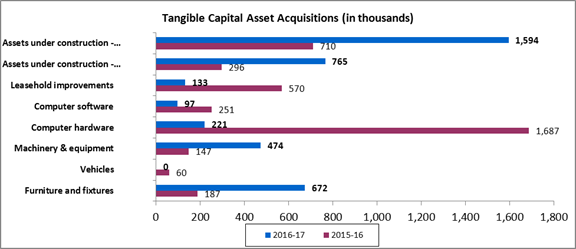
Description of the image
Expenses
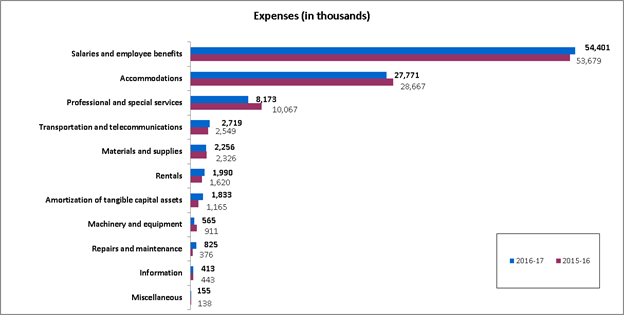
CAS’ total expenses were $101,101 thousand in 2016-17 ($101,941 thousand in 2015-16). The decrease of $840 thousand (1%) is comprised of decreases of $1,894 thousand in professional and special services, $896 thousand in accommodations, $346 thousand in machinery and equipment, $70 thousand in materials and supplies, and $30 thousand in information, offset by increases of $722 thousand in salaries and employee benefits, $668 thousand in amortization of tangible capital assets, $449 thousand in repairs and maintenance, $370 thousand in rentals and $170 thousand in transportation and telecommunications. Other smaller variances resulted in a net increase of $17 thousand. The variances are explained below.
The largest categories of expense are: salaries and employee benefits (54% of total expenses in 2016-17, 53% in 2015-16); and accommodation (27% of total expenses in 2016-17, 28% in 2015-16). These two categories make up 81% of total expenses in both fiscal year 2016-17 and 2015-16.
Description of the image
Expenses
In 2016-17, salaries and employee benefits expenses were $54,401 thousand. Accommodation expenses were $27,771 thousand. Professional and special services expenses were $8,173 thousand. Transportation and telecommunications expenses were $2719 thousand. Materials and supplies expenses were $2,256 thousand. Rentals expenses were $1,990 thousand. Amortization of tangible capital assets was $1,833 thousand. Machinery and equipment expenses were $565 thousand. Repair and maintenance expenses were $825 thousand. Information expenses were $413 thousand. Miscellaneous expenses were 155 thousand.
In 2015-16, salaries and employee benefits expenses were $53,679 thousand. Accommodation expenses were $28,667 thousand. Professional and special services expenses were $10,067 thousand. Transportation and telecommunications expenses were $2,549 thousand. Materials and supplies expenses were $2326 thousand. Rentals expenses were $1,620 thousand. Amortization of tangible capital assets was $1,165 thousand. Machinery and equipment expenses were $911 thousand. Repair and maintenance expenses were $376 thousand. Information expenses were $443 thousand. Miscellaneous expenses were $138 thousand.
Salaries and employee benefits:Salaries and employee benefits expense was $54,401 thousand in 2016-17 ($53,679 thousand in 2015-16). Salaries and employee benefits expense includes such costs as gross salaries and wages, overtime pay, retroactive salary adjustments, employee entitlements and allowances, severance pay, and pension and medical benefits. The $722 thousand (1.35%) variance is due to an increase of $1,017 thousand in salaries and wages and $357 thousand in employer contribution to the health and dental insurance plans (related party transaction). These increases were partly offset by decreases of $22 thousand in employer contributions to employee benefit plans and $630 thousand provision for severance benefits.
Accommodations: Accommodations expense was $27,771 thousand in 2016-17 ($28,667 thousand in 2015-16). This amount represents the value of accommodation services, including rent, provided without charge by Public Services and Procurement Canada, a common service organization providing accommodation services to the government.
Professional and special services:Professional and special services expense $8,173 thousand in 2016-17 ($10,067 thousand in 2015-16). Professional and special services include translation services, protection services, court reporter and transcript services, and IT and telecommunication services. The decrease of $1,894 thousand (19%) is largely driven by a decrease of $1,583 in translation and interpretation services compared to 2015-16 when additional funds were allocated to these services, $237 thousand in various services such as management consulting, legal services, audit services and other services, $168 thousand in informatics services and $54 thousand in protection services. These decreases were partly offset by an increase of $158 thousand in court reporters and transcript services. Other smaller variances resulted in a net decrease of $10 thousand.
Transportation and telecommunications:Transportation and telecommunications expense was $2,719 thousand in 2016-17 ($2,549 thousand in 2015-16). The increase of $170 thousand (6.7%) is mainly driven by an increase in postage and courier for court documents.
Materials and supplies:Material and supplies expense was $2,256 thousand in 2016-17 ($2,326 thousand in 2015-16). Material and supplies expense includes legal books, publications and subscriptions (except electronic subscriptions), as well as stationery and supplies. The decrease of $70 thousand (3%) is mainly due to a decrease of $60 thousand in books, publications and subscriptions for the judicial library, and $27 thousand in utility services (electricity). These decreases were partly offset by an increase of $41 thousand in miscellaneous chemical products, mostly toner for the multi-function photocopiers. Other smaller variances resulted in a net decrease of $24 thousand.
Rentals: Rentals expense was $1,990 thousand in 2016-17 ($1,620 thousand in 2015-16). The increase of $370 thousand (23%) is primarily due to a $344 thousand increase in rental of additional office space required for the Federal Court and for the physical security enhancement initiative, and $92 thousand in IT licenses and maintenance, partly offset by a decrease of $55 thousand in rental of machinery and equipment, namely photocopiers. Other minor variances results in a net decrease of $11 thousand.
Amortization of tangible capital assets:Amortization expense was $1,833 thousand in 2016-17 ($1,165 thousand in 2015-16). Tangible capital assets are expected to yield benefits over several years. Consequently, their cost is amortized on a straight-line basis over the estimated useful life of each asset class. The variance of $668 thousand (57%) is due to an increase of $403 thousand in amortization expense related to IT hardware assets, $146 thousand related to IT software, $57 thousand for other equipment including furniture, $48 thousand related to leasehold improvements and other minor increases of 14 thousand. In addition, many security-related capital assets acquired in 2016-17 were put in services late in 2016-17 and/or in 2017-18.
Machinery and equipment:Machinery and equipment expense was $565 thousand in 2016-17 ($911 thousand in 2015-16). This includes purchases of assets costing less than $5 thousand, such as small computer parts, office equipment, furniture, and motor vehicle parts. The decrease of $346 thousand (-38%) is mainly due to a decrease of $370 thousand in the acquisition of informatics equipment, including computer, communication and network equipment. Other minor variances resulted in a net increase of $24 thousand.
Repairs and Maintenance: Repair and maintenance expense was $825 thousand in 2016-17 ($376 thousand in 2015-16). The increase of $449 thousand (102%) is due to an increase of $384 thousand in repairs and maintenance to facilities, mostly at the 200 Kent Street building in Ottawa, $38 thousand in maintenance of communication network equipment and $38 thousand in other office equipment. Other smaller variances resulted in a net decrease of $11 thousand.
Information:Information expense was $413 thousand in 2016-17 ($443 thousand in 2015-16). The $30 thousand decrease (-7%) is due to decreases of $29 thousand in printing services, and $20 thousand in advertising services. These decreases were partly offset by an increase of $24 thousand in data and database access services for the judicial library. Other smaller variances resulted in a net decrease of $5 thousand.
Miscellaneous and Expenses incurred on behalf of Government:Miscellaneous expense was $163 thousand in 2016-17 ($141 thousand in 2015-16). The $22 thousand increase is due a $29 thousand increase in adjustments to payables at year-end, $10 thousand increase in amortization of prepaid expenses, partly offset by a $16 thousand decrease in bad debt expenses. Other minor variances resulted in a net decrease of $1 thousand. Expenses incurred on behalf of Government relate to bad debts on accounts receivable held on behalf of Government.
Revenues
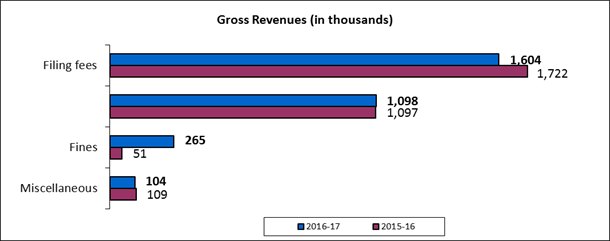
CAS’ gross revenues were $3,071 thousand in 2016-17 ($2,979 thousand in 2015-16). CAS’ revenues may fluctuate widely from year-to-year and consist almost entirely of revenues earned on behalf of Government. Such revenues are non-respendable by CAS and are deposited directly into the CRF. In 2016-17, these non-respendable revenues totalled $3,063 thousand ($2,976 thousand in 2015-16).
CAS’ net revenues were $8 thousand in 2016-17 ($3 thousand in 2015-16). This consists of revenues from the disposal of Crown assets, which are respendable.
Filing fees: Filing fees revenue was $1,604 thousand in 2016-17 ($1,722 thousand in 2015-16).
Filing fees are charged to register court documents pursuant to the legislation and Rules governing the Courts.
Recovery of administration costs – Employment Insurance: Recovery of administration costs for EI was $1,098 thousand in 2016-17 ($1,097 thousand in 2015-16). At the end of each fiscal year, CAS determines the cost associated with the administration of EI cases for presentation by Employment and Social Development Canada (ESDC), the department responsible for the EI account. Accordingly, ESDC reports an expense in its financial statements and CAS reports an equivalent revenue item. This accounting exercise is intended to reflect the total cost of running the federal government's EI program and does not involve any transfer of authorities or funds.
Fines:Fines revenue was $265 thousand in 2016-17 ($51 thousand in 2015-16). As noted previously, these fines are imposed by the Courts. Consequently, the total amount of fines revenue may vary significantly from year to year and cannot be predicted.
Miscellaneous: Miscellaneous revenue was $104 thousand in 2016-17 ($109 thousand in 2015-16). Miscellaneous revenue is composed of photocopy revenue and other miscellaneous revenues.
Description of the image
Gross Revenues
In 2016-17, filing fees revenues were $1,604 thousand. Recovery of administration costs - EI was $1,098 thousand. Fines revenues were $265 thousand. Other revenues were $104 thousand.
In 2015-16, filing fees revenues were $1,722 thousand. Recovery of administration costs - EI was $1,097 thousand. Fines revenues were $51 thousand. Other revenues were $109 thousand.
- Date modified: